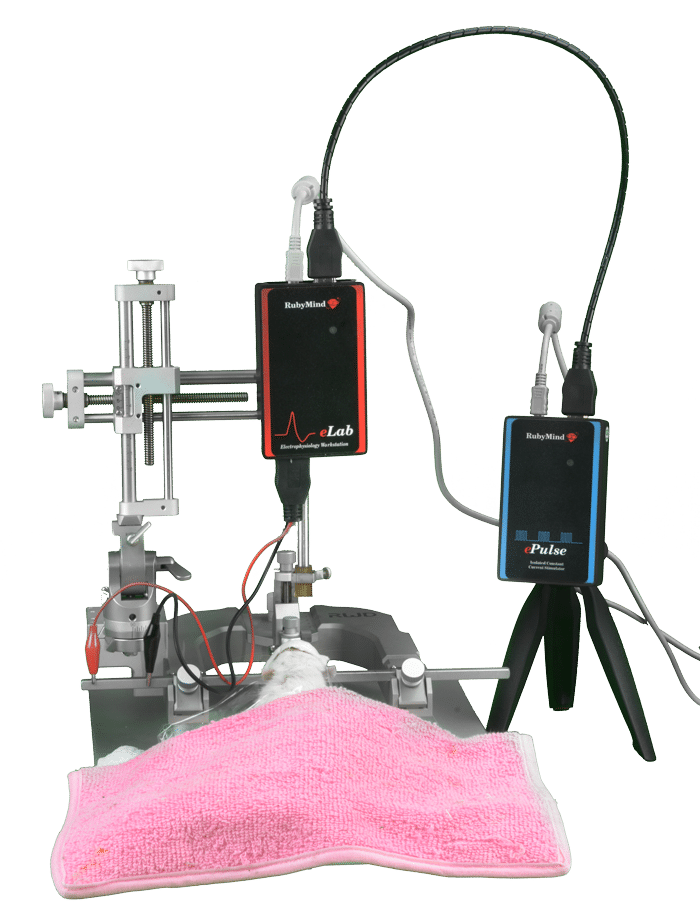
eProbe software lets you watch and probe almost all ranges of neuro/electrophysiological signals in superlative quality.
You can see streams online and offline. Also, great data analyzing tools associate you with your research.
eProbe has a different toolbox for recording signals, stimulation, data acquisition, and off-line analysis of a wide range of extracellular electrophysiology studies such as long-term potentiation (LTP), long-term depression (LTD), EEG, EMG and epileptiform, bursts activity, extracellular single-unit, multi-unit action potential, NCV, VEP, and ECG (RRI).
eTrace Analyze modes
To analyze field neuronal response, eTrace has a panel of different “analyze modes” and a box of various indicators, as illustrated in the following figure, to have a correct analyze you have to select an appropriate indicator.
eTrace analysis is designed to analyze various types of field responses, including full analysis of potential synaptic (Slope, Peak Amplitude, Latency, Area, Pop Spike Amplitude, etc.) as well as EEG, EMG, phase, and frequency of signals.
eProbe software Frequency: You can extract and analyze the frequency of the oscillatory activity of a neuronal population. Choose “Frequency” from the analyze panel mode then you will have “A” and “B” points.
SB-PS mode: You can calculate the PS amplitude for evoked responses that records from the somatic area or evoked field responses with Population spikes (PS).
Spike Count: In this item, you can calculate the number of spontaneous spikes in each recording epoch. For example, makes it possible to count interictal spikes in epileptic models and QRS peaks in an EKG or other spiking activities (regardless of their shape).
eSpike experiment mode
eSpike toolboxes are designed for single or multi-unit EXTRACELLULAR recording of neuronal activity and analyzing them.
Extracellular recordings are recorded by inserting microelectrodes into the CNS.
After amplification and bandpass filtering, the firing of the near neurons will appear as spikes.
According to articles, the neurons, which are close to the electrode tip (about 100 microns), have enough “signal-to-noise” ratio to distinguish the activity of every single unit.
For distant neurons (up to about 150 microns), spikes can be detected, but the difference in their shapes is masked by noise (multi-unit activity). For more than 150 microns, Spikes cannot be detected and they have been shown as background noise.
eSpike analysis
Four different modes are designed for data analysis in eSpike analysis. However, it is possible for users to create one or more new modes in accordance with their needs.
eProbe software Rate histogram:
It provides you with an offline drawing of a PSTH for one or more recording trials. PSTH shows the frequency distribution of the spikes during the time. As you see in the following figure, the “rate histogram” is selected as analyzing mode, and arranged histogram parameters.
Multi-Event
This is an analysis mode designed for a particular type of recording with a pattern of stimulation.
This PSTH shows a pattern according to the stimulation pattern applied during the recording. To do analysis on the PSTH “multi” includes different constant indicators.
These pointers are drawn according to the stimulation pattern. When you choose “multi” and set the bin size, the software automatically calculates the spiking activity between every two-pointers and will show it as a “SUM” in the analysis box.
SPINAL
This analysis mode provided for analyzing single of the neuronal unit activity in the spinal cord through a peripheral stimulation
Click one of our contacts below to chat on WhatsApp